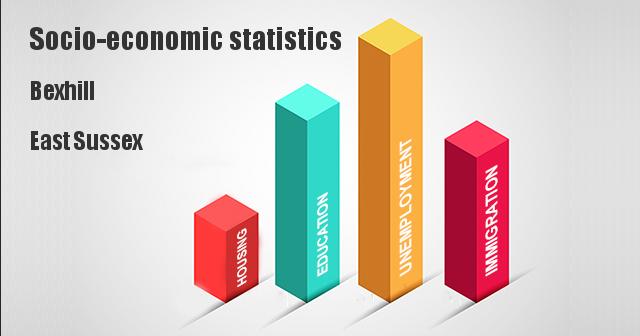
Is Bexhill in Rother a nice place to live or is it a bit rough? We have collated a series of socio-economic statistics and demographics from UK government sources such as the 2021 Census and the Index of Multiple Deprivation. They should give you a broad snapshot of the area and the surrounding locations. Are the residents of Bexhill older than the national average or younger? What is the population of Bexhill and Rother? What is the claimant count in Bexhill and how many residents are unemployed? This page should provide you with the answers.
Bexhill Unemployment Statistics
Since the introduction of Universal Credit, The Department for Work & Pensions have not issued any statistics (in our view) that can be used to ascertain the levels of unemployment or under employment in the UK, just meaningless geographic counts. However, the Office of National Statistics does publish claimant counts of people receiving out of work benefits, be that legacy Jobseeker’s Allowance or Universal Credit as a proportion of people over 16. These figures are usually updated once a month and are for Local Authority Districts and Unitary Authority Districts. So below are the figures of Rother.| Area | Unemployed | Yearly Change |
|---|
| Rother | 3.4% | -0.4% |
| South East | 2.9% | -0.3% |
| England | 3.8% | -0.3% |
| UK | 3.7% | -0.3% |
| Economic Status | Proportion |
|---|
| In Employment | 39.62% |
| In Part-Time Work | 33.26% |
| Unemployed | 5.23% |
Bexhill & Rother Immigration Statistics
We have analysed the Census 2021 raw data on country of birth and compiled immigration statistics as percentages of the population. All percentages have been rounded to two decimal places. Below are the figures for Bexhill in the Rother local area district.
Bexhill has a lower rate of immigrants than Rother, the South East region and England as a whole. | Area | Born in UK | Born outside UK |
|---|
| Bexhill Kewhurst | 93.22% | 6.78% |
|---|
| Rother | 92.45% | 7.55% |
|---|
| South East | 84.24% | 15.76% |
|---|
| England | 82.65% | 17.35% |
|---|
Bexhill compared to other wards in Rother
| # | Ward | Born in UK | Born outside UK |
|---|
| 1 | Bexhill Central | 87.12% | 12.88% |
|---|
| 2 | Bexhill Sackville | 88.03% | 11.97% |
|---|
| 3 | Robertsbridge | 88.76% | 11.24% |
|---|
| 4 | Bexhill Pebsham & St Michaels | 91.14% | 8.86% |
|---|
| 5 | Southern Rother | 91.88% | 8.12% |
|---|
| 6 | Bexhill Old Town & Worsham | 92.27% | 7.73% |
|---|
| 7 | Rye & Winchelsea | 92.55% | 7.45% |
|---|
| 8 | Bexhill Collington | 92.63% | 7.37% |
|---|
| 9 | Hurst Green & Ticehurst | 92.69% | 7.31% |
|---|
| 10 | Catsfield & Crowhurst | 92.91% | 7.09% |
|---|
| 11 | Burwash & the Weald | 92.94% | 7.06% |
|---|
| 12 | Bexhill Kewhurst | 93.22% | 6.78% |
|---|
| 13 | North Battle, Netherfield & Whatlington | 93.49% | 6.51% |
|---|
| 14 | Bexhill St Stephens | 93.68% | 6.32% |
|---|
| 15 | Brede & Udimore | 93.72% | 6.28% |
|---|
| 16 | Bexhill St Marks | 93.78% | 6.22% |
|---|
| 17 | South Battle & Telham | 93.78% | 6.22% |
|---|
| 18 | Northern Rother | 93.91% | 6.09% |
|---|
| 19 | Sedlescombe & Westfield | 94.03% | 5.97% |
|---|
| 20 | Eastern Rother | 94.51% | 5.49% |
|---|
| 21 | Bexhill Sidley | 94.64% | 5.36% |
|---|
';Bexhill is ranked 12 out of 21 wards in Rother for the number of residents born outside of the UK.What are the occupations of the residents of Bexhill?
The largest employment sector in Bexhill is Professional Occupations. The smallest employment sector is Process Plant & Machine Operatives.| Sector | Proportion |
|---|
| Professional Occupations | 18.19% |
| Managers, Directors & Senior Officials | 15% |
| Associate Professional & Technical | 13.41% |
| Administrative & Secretarial | 11.93% |
| Skilled Trades | 11.7% |
| Caring, leisure & Other Services | 10.75% |
| Elementary Occupations | 6.02% |
| Process Plant & Machine Operatives | 5.43% |
Bexhill Health Statistics
Bexhill Kewhurst has a significantly lower proportion of residents (>5%) describing their health as very good than the national average for England.| Area | VG | G | F | B | VB |
|---|
| Bexhill Kewhurst | 38.13% | 38.57% | 17.71% | 4.6% | 0.99% |
| Rother | 42.27% | 36.09% | 15.64% | 4.69% | 1.3% |
| South East | 49.98% | 34.01% | 11.77% | 3.31% | 0.93% |
| England | 48.49% | 33.71% | 12.65% | 3.98% | 1.17% |
VG = Very Good, G = Good, F = Fair, B = Bad & VB = Very Bad
How has the health of residents in Rother changed since 2011?
Rother residents who describe their health as either good or very good has increased by 1.21% between the 2011 and 2021 census.| Year | VG | G | F | B | VB |
|---|
| 2011 | 40.55% | 36.6% | 16.51% | 4.93% | 1.41% |
| 2021 | 42.27% | 36.09% | 15.64% | 4.69% | 1.3% |
VG = Very Good, G = Good, F = Fair, B = Bad & VB = Very Bad
Bexhill Education Statistics
We have taken the raw data from the 2021 census to found of the level of education Bexhill residents have in terms of formal qualifications as a percentage. The UK government breaks qualifications down into 7 levels. A detailed explanation of these levels can be found here. However, the Census groups these into just 4 \'levels\'. Here are some examples of the qualifications each census level represents when not stated;
- Level 1 - GCSE grades D, E, F, or G & below
- Level 2 - GCSE A*, A, B, C or O Level grades A, B or C
- Level 3 - A or AS qualification at any grade
- Level 4 - HNC, Bachelors Degree, Masters Degree or Phd
In this first table we have compared Bexhill to the national average for England.| Level | Bexhill Kewhurst | England |
|---|
| No Qualifications | 19.26% | 18.08% |
| Level 1 | 11.16% | 9.69% |
| Level 2 | 14.84% | 13.32% |
| Apprenticeship | 6.53% | 5.32% |
| Level 3 | 14.63% | 16.92% |
| Level 4 | 29.87% | 33.92% |
How many residents own or rent their home in Bexhill and Rother
We have taken the raw data from the 2021 census and calculated what proportion of people in Bexhill either own or rent their home. All percentages have been rounded to two decimal places. 83.12 of residents own their home either outright or mortgaged. 16.88 of Bexhill residents rent their home either privately or through a social landlord. | Area | Owned | Rented |
|---|
| Bexhill Kewhurst | 83.12% | 16.88% |
| Rother | 72.69% | 27.31% |
| South East | 65.66% | 34.34% |
| England | 61.31% | 38.69% |
Bexhill has a significantly higher level of home ownership than the national average. This is indicative or an economically wealthy area.
Bexhill compared to other wards in Rother
| # | Ward | Owned | Rented |
|---|
| 1 | Bexhill St Marks | 86.56% | 13.44% |
|---|
| 2 | Bexhill Collington | 86.1% | 13.9% |
|---|
| 3 | Bexhill Kewhurst | 83.12% | 16.88% |
|---|
| 4 | Southern Rother | 81.94% | 18.06% |
|---|
| 5 | Brede & Udimore | 80.44% | 19.56% |
|---|
| 6 | Sedlescombe & Westfield | 79.2% | 20.8% |
|---|
| 7 | Burwash & the Weald | 78.69% | 21.31% |
|---|
| 8 | Bexhill St Stephens | 78.13% | 21.87% |
|---|
| 9 | Northern Rother | 76.08% | 23.92% |
|---|
| 10 | Catsfield & Crowhurst | 75.96% | 24.04% |
|---|
| 11 | Robertsbridge | 75.93% | 24.07% |
|---|
| 12 | Hurst Green & Ticehurst | 75.51% | 24.49% |
|---|
| 13 | Bexhill Pebsham & St Michaels | 74.11% | 25.89% |
|---|
| 14 | North Battle, Netherfield & Whatlington | 73.45% | 26.55% |
|---|
| 15 | Bexhill Old Town & Worsham | 72.82% | 27.18% |
|---|
| 16 | Eastern Rother | 70.52% | 29.48% |
|---|
| 17 | South Battle & Telham | 69.87% | 30.13% |
|---|
| 18 | Bexhill Sackville | 67.57% | 32.43% |
|---|
| 19 | Rye & Winchelsea | 62.7% | 37.3% |
|---|
| 20 | Bexhill Sidley | 50.59% | 49.41% |
|---|
| 21 | Bexhill Central | 48.89% | 51.11% |
|---|
Bexhill is ranked 3 out of 21 wards in Rother for the percentage of home owners.Bexhill Age Distribution Statistics
We have taken the raw data from the 2021 Census and the calculated the proportion of age groups in Bexhill Kewhurst.| Age Band | Proportion |
|---|
| 4 & under |  |
| 5 - 9 years | |
| 10 - 15 years | |
| 16 - 19 years | |
| 20 - 24 years | |
| 25 - 34 years | |
| 35 - 49 years | |
| 50 - 64 years | |
| 65 - 74 years | |
| 75 - 84 years | |
| 85 years & over | |
What is the population of Bexhill and Rother?
The table below contains the populations figures for each ward in Rother including Bexhill. These population ONS figures are estimated are dated Mid 2020.
| Ward | Population |
|---|
| Bexhill Central | 6029 |
| Bexhill Collington | 4318 |
| Bexhill Kewhurst | 4906 |
| Bexhill Old Town & Worsham | 4392 |
| Bexhill Pebsham & St Michaels | 5302 |
| Bexhill Sackville | 5222 |
| Bexhill Sidley | 6144 |
| Bexhill St Marks | 4666 |
| Bexhill St Stephens | 5185 |
| Brede & Udimore | 2124 |
| Burwash & the Weald | 4746 |
| Catsfield & Crowhurst | 2670 |
| Eastern Rother | 5179 |
| Hurst Green & Ticehurst | 5455 |
| North Battle, Netherfield & Whatlington | 5445 |
| Northern Rother | 5036 |
| Robertsbridge | 2730 |
| Rye & Winchelsea | 5279 |
| Sedlescombe & Westfield | 5373 |
| South Battle & Telham | 2203 |
| Southern Rother | 4312 |
| Rother Total | 96716 |
Last updated: 20/02/2024, Additional Sources: Office for National Statistics & Department for Work & Pensions.