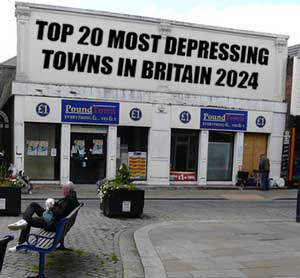
Is Brownhills a nice place to live or is Brownhills rough? Forget local estate agents sales speil and local councillors who say that Brownhills is on the up an up, it's time for a bit of reality. Cold hard statistics culled from the Police, the Indices of Deprivation and the latest census. Is Brownhills truly a nice place to live, or are Burntwood, Aldridge and Pelsall a lot better? Time to find out.
What are the crime levels like in Brownhills?
Using the latest Police street crime figures (typically from 3 months ago) we have compiled a table of the most voilent Policing areas in and around Brownhills. Naturally the more urban and more central areas will have a higher rate of crime, but often you can be surprised when that is not the case and that is the area you want to move to.| Policing Area | Voilent Crimes |
|---|---|
| Chasetown | 51 |
| Shire Oak | 46 |
| Catshill | 43 |
| Brownhills | 40 |
| Holly Bank | 37 |
| Walsall Wood | 33 |
| Rushall Canal | 33 |
| Springhill | 25 |
| Highbridge | 24 |
| Hammerwich | 16 |
The English Indices of Deprivation also has crime statistics for Brownhills. These statistics are published by the government every 2-3 years. They are a measure of how likely you are to be a victim of personal or material crime in an area, such as muggings or burglary. We've taken the rank average for wards in and around Brownhills and compared them. The table below shows ten wards in this area, from the best to the worst.
| Ward | Average rank in England |
|---|---|
| Summerfield & All Saints (Best) | 25394/32845 |
| Chase Terrace | 24828/32845 |
| Boney Hay & Central | 23013/32845 |
| Aldridge North and Walsall Wood | 20422/32845 |
| Great Wyrley Landywood | 19948/32845 |
| Pelsall | 17897/32845 |
| Brownhills | 17448/32845 |
| Rushall-Shelfield | 17115/32845 |
| Norton Canes | 16633/32845 |
| Chasetown (Worst) | 14680/32845 |
Walsall, there are unfortunately no plus sides to living in this hell hole
Your Health in Brownhills
If you are thinking of moving to Brownhills, you want to know if the place is likely to put you on a downward spiral of ill health. We've taken the healh question from the latest census to find out and how Brownhills compares to its neighbouring local authorities. People were asked to rate their current health from very bad to very good;
| Town | Very Bad | Bad |
|---|---|---|
| Walsall (Brownhills) | 1.68% | 5.56% |
| Wolverhampton | 1.66% | 5.53% |
| Cannock Chase | 1.52% | 5.25% |
| Lichfield | 1.19% | 3.93% |
The English Indices of Deprivation also has health statistics for Brownhills. They measures the risk of premature death and the impairment of quality of life through poor physical or mental health, lovely! We've collated an average rank for all the Lower Super Output Areas (LSOA) in each ward in and around Brownhills. The table below shows ten wards in this area, from the best to the worst;
| Ward | Average rank in England |
|---|---|
| Chase Terrace (Best) | 20253/32845 |
| Great Wyrley Landywood | 18854/32845 |
| Boney Hay & Central | 17390/32845 |
| Summerfield & All Saints | 17129/32845 |
| Norton Canes | 15895/32845 |
| Chasetown | 14363/32845 |
| Pelsall | 12515/32845 |
| Aldridge North and Walsall Wood | 11248/32845 |
| Rushall-Shelfield | 8952/32845 |
| Brownhills (Worst) | 8869/32845 |
Stonnall, in the middle of nowhere between Walsall and Lichfield
Deprivation in Brownhills
Using the English Indices of Deprivation statistics, we've collated the average Index of Multiple Deprivation rank of all the LSOAs in the wards in and around Brownhills. In layman's terms, this is how rough the ward is based on mutiple measures of deprivation including; employment, income, health, crime, housing and outside space.
| Ward | Average rank in England |
|---|---|
| Chase Terrace (Best) | 23244/32845 |
| Boney Hay & Central | 20597/32845 |
| Summerfield & All Saints | 18352/32845 |
| Great Wyrley Landywood | 17930/32845 |
| Aldridge North and Walsall Wood | 17714/32845 |
| Pelsall | 17292/32845 |
| Norton Canes | 15199/32845 |
| Rushall-Shelfield | 11848/32845 |
| Chasetown | 10845/32845 |
| Brownhills (Worst) | 10338/32845 |
Average rent in Brownhills
Every six months the Office for National statitics publishes a snapshot of rental costs. These statistics for Brownhills are dated September 2021. They are split into three figures, the lower quartile, mean and upper quartile. If you recieve housing benefit or the housing benefit section of Universal Credit, the lower quartile is at the top limit of what would be affordable. The mean is the average you'd expect to pay for a rental property and the upper quartile is the average rental cost of the most expensive 25% of properties in Brownhills.

Weekly Gross Pay and Hourly Pay in Brownhills
If you are thinking of moving to Brownhills, you'll want to know how much you can earn in a job in the town. The government publish regular statistics on gross weekly pay and pay per hour.


